Lack of data is not a problem for the majority of SaaS companies. Too much of it causes them problems. Dashboards keep expanding, attribution is unclear, and many metrics appear helpful but don’t truly explain what generates revenue.
Tracking more numbers in 2026 won’t make the issue go away. Selecting metrics that point to real growth and reveal vulnerabilities early on is crucial.
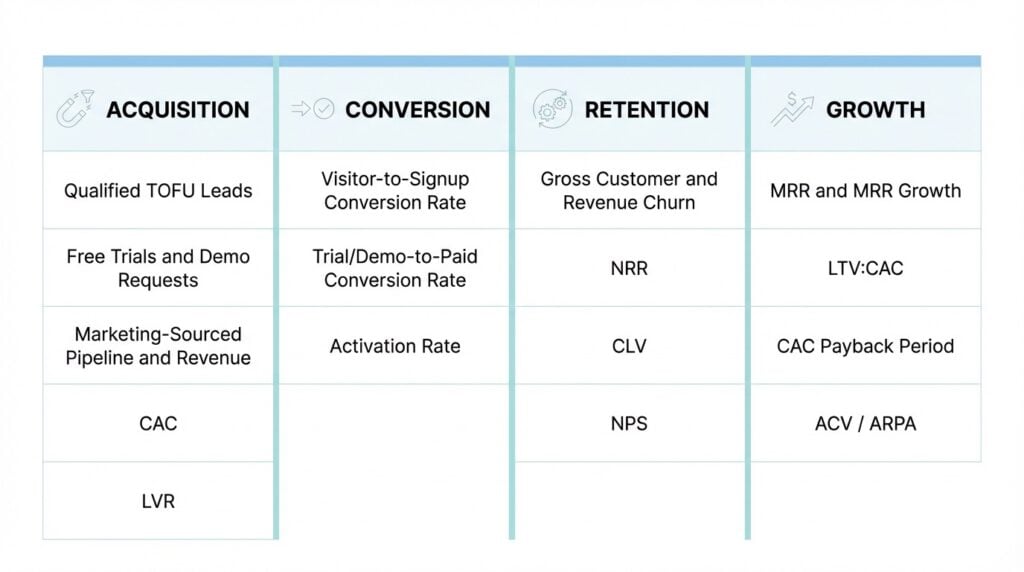
The goal of this article is to simplify the landscape and lay out the 16 metrics that matter most for predictable SaaS growth. In order to provide you, as a founder or growth leader, with a clear framework your team can rely on in 2026, we have categorized them into acquisition, conversion, retention, and long-term growth.
Why Choosing the Right SaaS Marketing KPIs Matters
Now, why exactly do you need to focus on specific SaaS marketing KPIs instead of just checking them all?
As we’ve mentioned earlier, most SaaS teams have plenty of data, but not much clarity. If you keep on tracking all the KPIs out there, your dashboards will fill up quickly, without actually helping you understand what worked and what didn’t.
In reality, only a few metrics help teams decide where to invest, what to stop, or which channels are pulling their weight.
The right KPIs will help focus attention on long-term revenue, conversion, and buyer quality.
What Are the 16 Most Important Marketing Metrics for SaaS?
To make these metrics easier to work with, we group them into four areas: acquisition, conversion, retention, and growth. Each group answers a different question, from how customers are acquired to how efficiently revenue compounds over time.
Acquisition Metrics
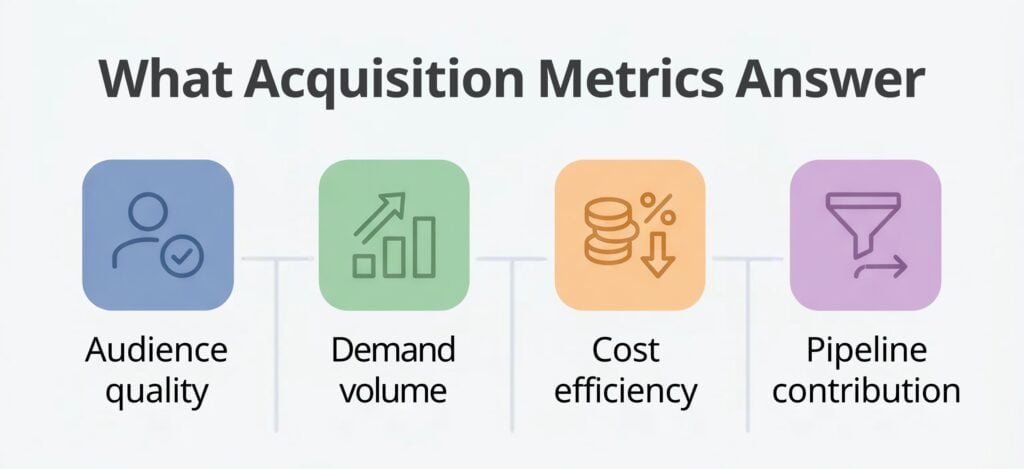
SaaS customer acquisition metrics are the cornerstone of any serious growth model because they demonstrate whether your marketing is drawing in the right customers at a cost that makes sense.
Qualified Top-of-Funnel Leads
Qualified TOFU leads are prospects that match your target customer profile and show real buying intent. Unlike raw traffic, these leads indicate whether your campaigns are reaching people likely to convert.
Channels contribute differently: search often captures active intent, paid social can broaden awareness, and content attracts engaged, self-educated buyers.
Tracking this metric will let your team focus on quality over volume, seeing if their efforts bring the right audience rather than just clicks.
Free Trials and Demo Requests
Trial signups and demo requests act as early signals of product interest. Not all signups are equal: some may never engage with the product.
Measuring qualified trials will help you track the real demand. Paid ads, landing pages, and inbound content each influence trial quality differently. This metric shows whether marketing attracts users who are genuinely evaluating the product. It often acts as an early indicator of conversion and future revenue.
Marketing-Sourced Pipeline and Revenue
Marketing-sourced pipeline measures the revenue and opportunities that originate from marketing activity. It provides accountability for spending and demonstrates marketing’s contribution to growth. Attribution matters. First-touch models show which channels spark interest, while multi-touch shows which campaigns push deals forward.
If your company is trying to digitally market its SaaS business, this metric helps with budgeting decisions and identifying channels that consistently drive pipeline and revenue.
Customer Acquisition Cost (CAC)
Tracking CAC contributes to your overall SaaS growth metrics analysis. CAC measures the total cost of acquiring a paying customer, including marketing and sales expenses.
It tells teams whether campaigns are sustainable and highlights areas where costs may be too high. Comparing CAC across channels or campaigns helps decide where to scale or pause spending.
In SaaS, understanding CAC is critical for planning growth, balancing acquisition, and aligning campaigns with business goals.
Lead Velocity Rate (LVR)
Lead velocity rate tracks month-over-month growth in qualified leads, providing a forward-looking view of pipeline health. A high LVR signals expanding demand, while stagnation can warn of slower future revenue. Unlike lagging metrics, LVR helps teams act before revenue dips. It also highlights whether acquisition channels are performing consistently.
Monitoring LVR is especially useful if your team wants a predictive metric connecting key SaaS marketing metrics to actual business growth.
Conversion Metrics
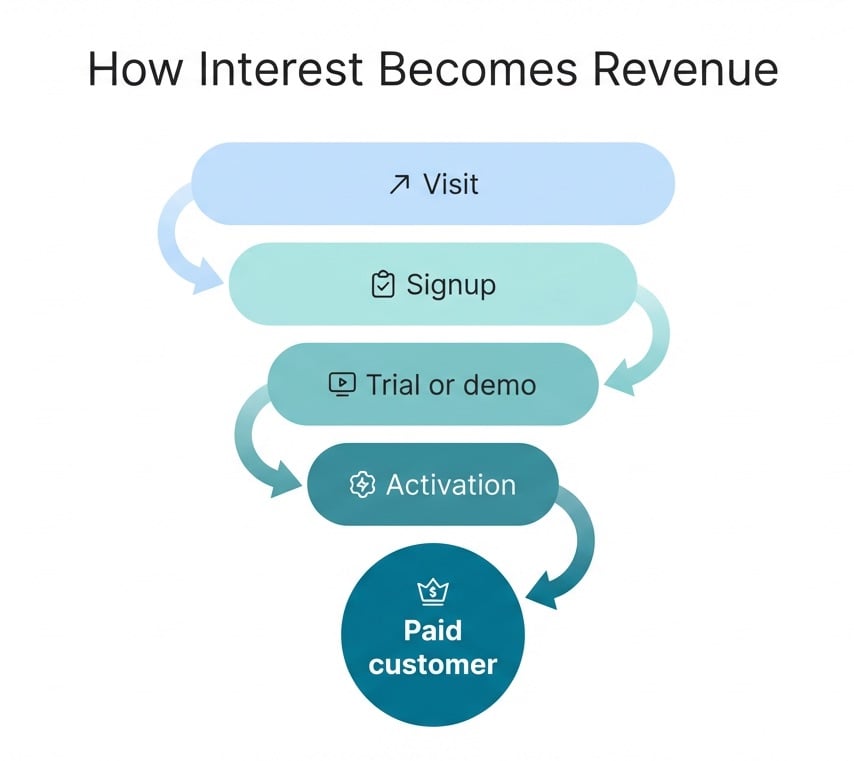
Conversion metrics show how well your marketing and product work together to turn interest into paying customers. They reveal weak points in the funnel and help teams act on what actually moves users closer to value.
Focusing on the right conversion metrics makes sure your traffic, trials, and demos are not just activity but potential revenue for your business.
Visitor-to-Signup Conversion Rate
Visitor-to-signup conversion rate measures the share of website visitors who become leads, trials, or demo requests. It reflects how well landing pages, PPC campaigns, and messaging match audience intent. Low conversion can signal misaligned targeting, unclear value propositions, or weak calls to action.
Tracking this metric helps teams improve audience quality and site performance, showing which pages and campaigns effectively use SaaS conversion metrics for real business outcomes.
Trial/Demo-to-Paid Conversion Rate
This metric helps teams understand how trial and demo performance affects revenue within broader B2B SaaS marketing metrics.
It tracks how many trials or demos become paying customers. It highlights product-market fit, onboarding quality, and sales follow-up effectiveness. Poor conversion may indicate friction during the trial, unqualified leads, or gaps in product experience.
Measuring trial-to-paid conversion helps teams focus on improving user experience and lead quality rather than simply driving more signups.
Activation Rate (First Value Moment)
Activation rate measures the percentage of users who reach a meaningful first action in the product, like completing a key setup or using a core feature. High activation correlates with better retention and trial-to-paid conversion.
For example, a project management SaaS might define activation as creating the first task or inviting team members.
Tracking activation shows whether your marketing is attracting users who find value quickly and supports SaaS KPIs tied to long-term revenue.
Retention Metrics
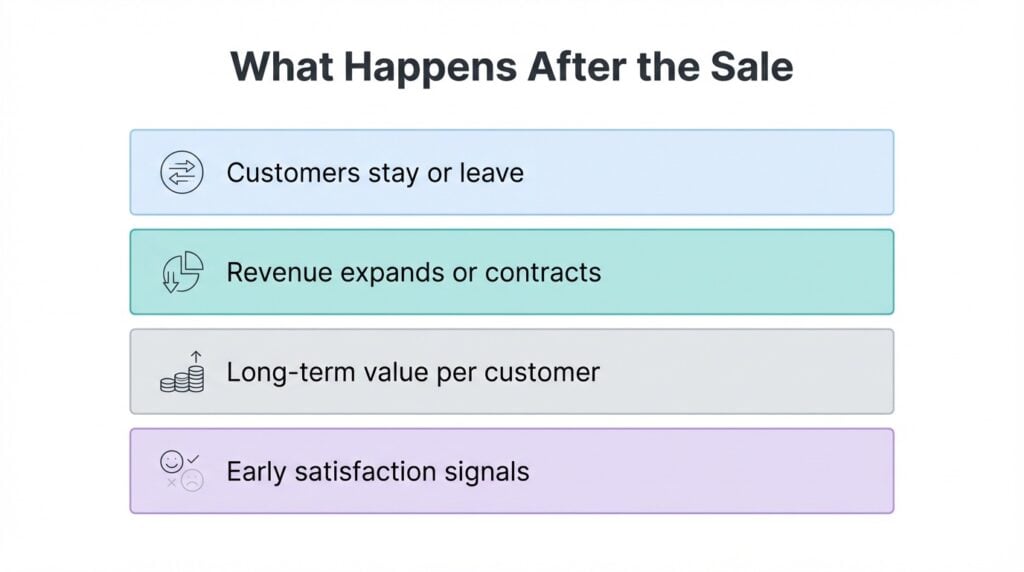
SaaS retention metrics show what happens after the deal closes. They tell you whether customers stay, expand, or leave, and how those outcomes affect revenue over time. Strong acquisition can hide weak retention for a while, but the numbers always catch up.
Gross Customer and Revenue Churn
Churn measures how many customers or how much revenue you lose over a given period. Customer churn looks at logos lost. Revenue churn looks at dollars lost. Both matter.
A small increase in churn can have a compounding effect on MRR, especially in subscription models. Losing a few large accounts can hurt more than many small ones.
Tracking both views will help your team understand where losses come from and whether pricing, onboarding, or customer fit needs attention.
Net Revenue Retention (NRR)
Net revenue retention shows how revenue from existing customers changes over time after upgrades, expansions, downgrades, and churn. It is often seen as one of the clearest signals of SaaS health. A strong NRR means the product keeps customers and grows with them. A weak one points to leakage that marketing alone cannot fix.
Investors watch NRR closely because it shows whether growth depends on constant acquisition or comes from a stable customer base.
Customer Lifetime Value (CLV)
CLV measures the total revenue a customer generates before they churn. It helps teams set realistic limits on acquisition spending and decide which segments are worth pursuing. Pricing, upsells, churn rate, and onboarding quality all affect CLV.
If customers leave early or never expand, CLV drops fast. When CLV is clear, marketing teams can evaluate whether paid channels, including SaaS PPC services, are effective or if spending needs to be adjusted.
Net Promoter Score (NPS)
Net promoter score captures how likely customers are to recommend the product. While it is not a revenue metric on its own, it acts as an early signal of satisfaction and churn risk. Low scores often point to product friction, support gaps, or broken expectations set during acquisition.
SaaS teams use NPS feedback to spot patterns, prioritize fixes, and improve the full customer experience. Over time, this feedback loop supports stronger retention and expansion.
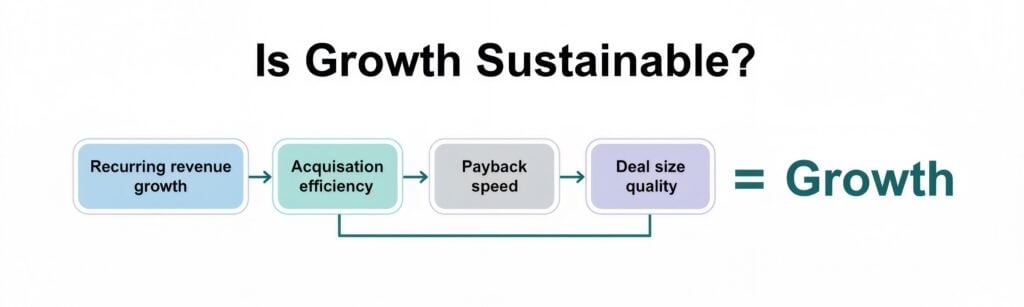
Growth Metrics
Once leads turn into customers, these metrics show how well the growth strategy is working. These metrics help you understand not just how fast you’re growing, but how healthy and sustainable that growth really is.
Monthly Recurring Revenue (MRR) and MRR Growth
MRR is the core number most SaaS teams track closely. It shows predictable revenue from subscriptions and how that total changes month to month. New MRR comes from new customers, expansion MRR from upgrades, and churned MRR from lost accounts. Marketing influences new MRR, sales shape deal quality, and product affects expansion and churn.
Marketing influences new MRR, sales shape deal quality, and product affects expansion and churn.
LTV: CAC Ratio
The LTV-to-CAC ratio compares how much revenue a customer brings in over time versus what it costs to acquire them. It is a simple way to check how financially sustainable the growth is:
- A low ratio signals overspending or weak retention.
- A high ratio gives more room to invest at a lower risk.
Teams use this ratio to judge channel mix and budget changes across SaaS marketing KPIs that tie spend to revenue.
CAC Payback Period
The CAC payback period measures how long it takes to recover acquisition costs from customer revenue. Shorter payback periods reduce risk and free up cash sooner. Longer ones limit flexibility and slow growth.
This metric matters most when scaling paid channels, since capital gets tied up until costs are recovered. Payback period helps teams decide when to increase spending, when to pause, and how much runway they have.
Annual Contract Value (ACV) / Average Revenue per Account (ARPA)
ACV, or ARPA, shows the typical value of a customer contract. It shapes how marketing teams think about targeting and deal quality. Higher deal sizes can support higher acquisition costs, while lower ones demand tighter control. This metric helps align messaging, channels, and offers with the customers who create the most value.
It is also useful for connecting marketing decisions with broader SaaS product marketing and revenue strategy.
SaaS Marketing Metrics to Follow
You don’t need dozens of metrics to understand how you’re really performing. You need a small, focused set that shows how customers are acquired, how they convert, how long they stay, and how revenue grows over time.
When you look at these metrics together, it becomes much easier to see where growth is real and where it’s just activity without payoff.
This year, your goal should be to have clean dashboards, not just big ones.
By removing vanity metrics, teams can optimize your SaaS marketing ROI by focusing on what actually moves MRR, CAC, and payback. Teams that track the right KPIs make decisions faster, spend with more confidence, and build growth that holds up over time.
FAQs
What are the key SaaS marketing metrics every company should track?
The core metrics most SaaS teams need are the ones that explain acquisition quality, conversion, retention, and revenue. That usually includes CAC, trial or demo conversion, activation, churn, NRR, and MRR growth. Together, these show how marketing brings in the right buyers andhow revenue holds over time. Teams that digitally market your SaaS business without these signals often chase volume while missing the real drivers of sustainable growth.
How do SaaS growth metrics differ from traditional marketing metrics?
Traditional marketing metrics focus on reach, clicks, and short-term outcomes. SaaS growth metrics focus on what happens after the first conversion. Retention, expansion, and recurring revenue matter more than impressions or traffic alone. Because SaaS revenue compounds over time, growth metrics track customer behavior across months or years. This is why SaaS marketing strategies tend to prioritize lifecycle performance and revenue impact over one-off campaign results.
What is the 3 3 2 2 2 rule of SaaS?
The 3 3 2 2 2 rule is a rough planning framework used by some SaaS teams to think about growth balance. It often refers to targeting growth from new customers, expansions, and pricing while managing churn and costs. The exact breakdown varies by company. It is not a strict formula but a reminder that growth usually comes from multiple levers working together, not a single channel or tactic.
What is the 10x rule for SaaS?
The 10x rule in SaaS usually means building a product or message that is clearly better than existing alternatives. From a marketing perspective, it pushes teams to focus on strong differentiation rather than incremental improvements. This mindset affects positioning, content, and demand generation. It also influences how teams evaluate channels like SaaS PPC services, since weak differentiation often leads to higher costs and lower conversion.
What is the rule of 40 in SaaS metrics?
The rule of 40 combines growth rate and profit margin to assess overall SaaS health. If the two add up to 40 percent or more, the business is often seen as balanced between growth and sustainability. While it is more common in investor conversations, it still matters for marketing. Strong SaaS product marketing supports growth without pushing acquisition costs beyond what the business can support.